Sunday, December 27, 2015

Support for OBD Fusion added

Unfortunately, the Torque Pro app is not available for iOS, so one of the recurring questions is: how do I log data with my iPhone?
Thanks to Hybrid-Brain of Hybrid Synergy Forum, now Torque Log Analyzer supports log files from the OBD Fusion app, that also runs on iOS.
Just import you CSVLog file as usual and run Torque Log Analyzer.
You'll still need to import the custom PIDs as usual, to fully access all the available charts.


Saturday, December 19, 2015

Info/Suggestions on Torque Log Analyzer

If you need info or have any suggestions on Torque Log Analyzer, you can find an email address to contact in the About menu.


Saturday, December 12, 2015

Inverter Temperature

Torque Log Analyzer now draws Inverter Coolant Temperature on the Temperature chart. Note that one more PID is needed: check the FAQ page for the complete list of required PIDS.


Saturday, November 28, 2015

Map your car fuel consumption

Torque Log Analyzer can be used on non-Hybrid cars also.
Here's a sample, using the RPM & Fuel Distribution chart, to map fuel consumption.
You'll need to collect RPM, FuelFlow (cc/min), and OBD Speed PIDs, which are standard PIDs, available for every car model.

As fuel consumption, at a given speed, is affected by many factor, (temperature, acceleration, slope), one single trip won't give consistent results, so collect multiple trips.
Best trips are:
1) trips on the same road, in both directions (to even out elevation differences), with similar weather conditions.
2) trips with long stretches of constant speed
3) different speeds on the same trip
4) same PIDs on all the trips, in the same order.
5) record mileage reported by the on-board computer for each trip, in L/100km.

Open the first csv log file
Select File / Import and choose the second log file
Select "Append rows to current sheet" as the import action
Repeat for all the log files.

Start Torque Log Analyzer
Select Additional Analytics / RPM & Fuel distribution
Select Option / Car: non-Hybrid
Select Option / Flow Correction Factor and set it to the value explained at this link

Click Analyze

Here is the result for a Fiat Panda 4x4 1.3Mj 75cv:


Friday, November 27, 2015

Flow Correction Factor

You may have noticed that the mileage reported by Torque is different from the consumption measured at the fuel station with the full-to-full method.
The Flow correction factor is applied to the Fuel Flow reported by Torque, to get results consistent with the one measured at the fuel station.

You can compute the flow correction factor following these steps:
1) Fill up fuel tank
2) Reset trip mileage and odometer.
3) Drive until a new fill up is required
4) At the new fill up write down trip distance and mileage (let's call them tdist and tmil) and the litres needed to fill up the tank. (l)

Note: mileage here is intended measured in litres/100Km

Calculate the effective mileage:
emil = (l / tdist) * 100

and then the offset from reported:

off = emil / tmil

For example, for a Fiat Panda 1.3Mj 75cv 4x4 Diesel car, I run 511 km with 27.58 litres, while the trip mileage indicator was 5.0l/100km

The effective mileage is (27.58 / 511) * 100 = 5.39 l/100km
While the offset is 5.39 / 5.0 = 1.078

So, every time the car is reporting a given mileage, the effective consumption is really 1.078 times the indicated value.

To calculate the Flow Correction Factor, you'll need a trip log on which you also recorded the mileage as indicated by the on-board computer of the car.
Now, load up a trip in Torque Log Analyzer and run an analysis with the Force Mileage option set to the mileage reported by the car from that trip (4.8 L/100km in this example)


After the Analyze run is completed, switch to the Calc sheet and get the CDB Correction value:


Repeating the procedure with several different trips and averaging the results, will give more precision.
For the example car (Panda) this resulted in 0.82120

Saturday, October 10, 2015

S1b charging values

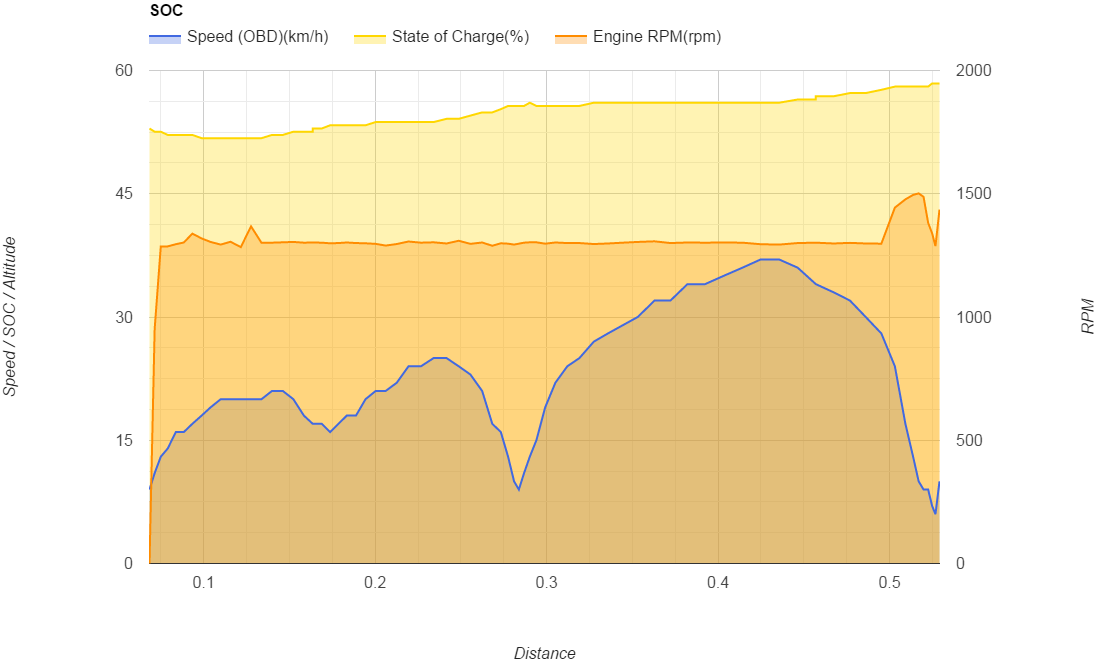
It's a common rule of thumb that, while perfoming the first cold ignition of the Yaris Hybrid, you can push up to the 2nd mark of the ECO level without draining the battery.


This seems not to be always the case.
I've observed that at a low SOC level (battery indicator at 4 bars), you can push as much as the half of the ECO zone, and still charge the battery.

Look at this chart, where S1 starts with SOC > 50%.
As soon as the Hybrid System Indicator raises over the second mark, Battery Current goes positive, thus draining power from the battery to push the car.
This is the commonly observed behavior.


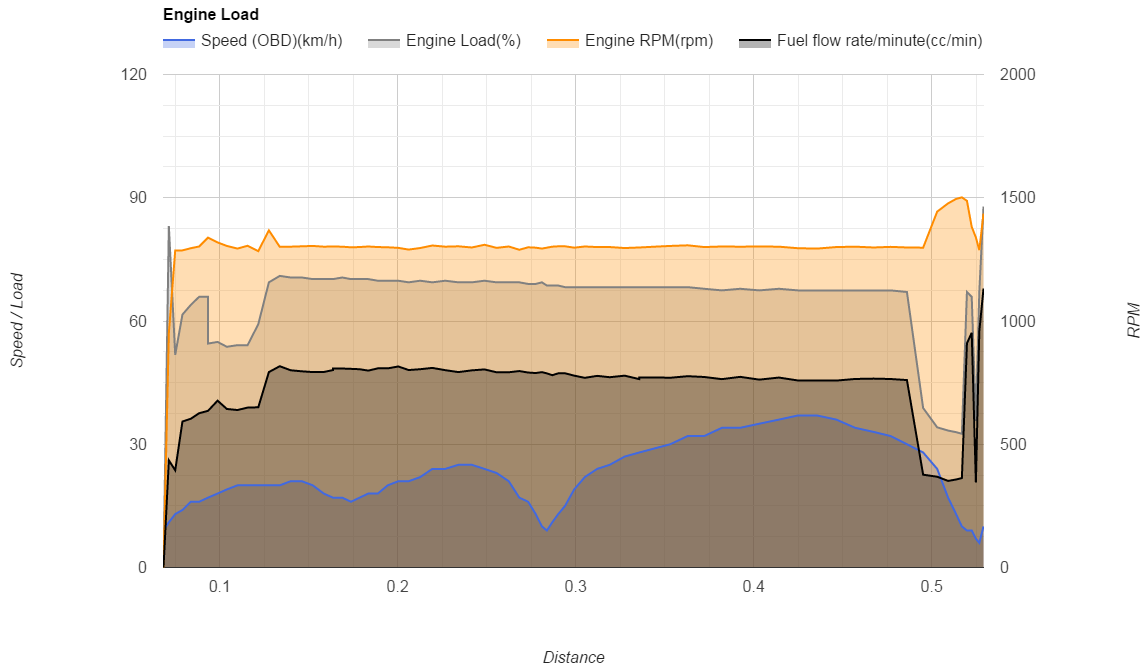
Now, look at this chart, where S1 starts with SOC < 50% (4 bars on the dashboard).
Even going with the power meter at half of the ECO scale, current remains negative (flowing from the motor/generator to the battery pack).


So, where is this additional current coming from?
Engine RPM are the same in both cases:


Let's check Load and Fuel Flow:


Same values in both scenarios also.
This scenario has been investigated on a Hybrid Synergy Forum thread.


Saturday, October 3, 2015

Highway engine speed and consumption

Here is a chart of several highway trips pasted together, to have a wide number of samples.
All trips were back and forth on the same road, so altitude differences were evened out.
Values are significant after 75 km/h, when you can't have electric engine running alone, and after that, more samples lead to more consistent results.


Sunday, September 20, 2015

Hello Toyota, happy to see you here too...

It seems that some of the analysis provided by Torque Log Analyzer are relevant for non-geek also:

http://www.toyota.it/tecnologia-hybrid/testdrivedellaverita.json

Even though this has nothing to do with Torque Log Analyzer, this marketing move just seems to acknowledge that some of the questions this site tries to answer, are relevant to their (potential) customers also:
Now I'm waiting you to answer also:


But the main question is:

Why all this information is not already available on the standard car cockpit?

So, please, marketing guys from Toyota that are reading this, just pass it on to the engineering...


Tuesday, August 25, 2015

DIY Hybrid Check

You can use Torque Log Analyzer to check your HV Battery health.

This procedure has been used to diagnose batteries with error P0A80 or “Check Hybrid System”, by identifying the faulty block.

You'll need:
  1. Android phone (a low-end model is fine, even without any SIM, a wi-fi connection is enough)
  2. Torque Pro from Google Play (the free version can't be used for this test) https://play.google.com/store/apps/details?id=org.prowl.torque


Follow this steps:


  1. Install Torque on the phone
  2. Load the custom PID list by following this tutorial: http://torqueloganalyzer.blogspot.it/2014/01/loading-custom-pids-on-torque.html
  3. In order to collect significant data, we need to cause a battery discharge. We'll use the same method used by Toyota while performing the Hybrid Check:
    1. Push the brake pedal with your left foot
    2. Switch to gear R
    3. While keeping the brake pedal pressed, push the accelerator pedal to engage the electric motor. The car won't move anyway, because of the brake pedal.
    4. If the petrol engine kicks in, decrease pressure on the accelerator, to turn it off.
    5. Keep going until battery level gauge is at 2 bars and the petrol engine starts to recharge it.
  4. Collect log using the above steps.
  5. Load log into Torque Log Analyzer, as exaplained here: http://torqueloganalyzer.blogspot.it/2014/08/tutorial.html
  6. Select HV Battery Fitness in the Analytics section and run.

A fine battery will show uniform block behavior, as seen here:

While a faulty battery will have its blocks scattered:

Saturday, August 22, 2015

Seasonal Fuel Economy Variance

Here is one year of gas consumption data from my daily commute trip.
Chart shows how winter affect consumption: fuel economy is better in warmer months; more than 1 l/100Km in my test case.
It's a 9+9Km trip to work and back: a longer trip will lead to better and more consistent fuel economy results.
Anyway, this is a real-world scenario: car was between 20.000 and 30.000 Km while these data was collected. I expect even better results when the car will have more kilometers under its wheels.
Time will tell.


Friday, August 14, 2015

Learning to Brake

Toyota Hybrids have 2 braking systems, both controlled by the brake pedal.

  1. The first is the friction braking system, as in classic cars, which slows down the car by pushing the brake pads onto the brake disks of the wheels.
  2. The second is the regenerative braking system, which uses the electric motor to slow down the car while charging the battery with the kinetic energy recovered.

The second one is the one you should use as much as possible to optimize your fuel consumption.
Given that both systems are controlled by the same pedal, it’s important to understand how to use it correctly.
As a general rule, slower, gentle pressing of the brake pedal will trigger regenerative braking, while sudden and stronger pressing will force the friction system to kick in.

Being primarly a foot sensitivity issue, some kind of feedback will help you to better judge your braking performance: this can be accomplished by using Torque on your phone.

You’ll need the Torque Pro Android app; the free version doesn’t allow customizations.

Import the custom PID csv file as explained here.
Go in the “Real Time Information” screen

Select “Add display” from the menu

Select the “Graph” display

Select “Wheel Cylinder Pressure Sensor”

Select a size according to your phone screen size
Long tap the newly added chart
Select “Display configuration”

The default scale won’t allow you to clearly read transitions, so set maximum value to 0.8 and minimum value to 0.1


Turn on your car and pair the bluetooth adapter.
Test it by pressing the brake pedal with the car parked.
You should see a spike in the chart.
The chart displays the last 9 seconds, so you can actually focus on driving and check the screen later, when safety conditions are met.
A good, fully regenerative braking will show a flat line


Please keep in mind that under 12 km/h, friction braking will always kick in, no matter how light you push the pedal.

Thursday, August 13, 2015

Estimated Resistance

Block resistance values reported by OBD are suspected to be inconclusive, or at least they show a strange behavior:

User Lesolee from the Toyota Owners Club forum, suggested to apply Ohm's law to calculate resistance of each block based on measured voltage and current.
So, for each measure of every block, current and previous voltage values are used to calculate a delta V, which is divide by delta I, obtained from current and previous battery current value.


Sunday, May 3, 2015

R30

News:


HV Battery error threshold

According to this article, Toyota sets a maximum acceptable delta between highest and lowest battery block at 1.2V
I suspect this difference alone is not enought to trigger the error.
I logged two different trips on a faulty Prius 3.
The first trip didn't trigger the error.
The second one did.

In the first trip, delta was above 1.2V for 5 seconds


In the second trip, delta was above 1.2V for 14 seconds, and the error was triggered

Wednesday, April 29, 2015

R29

News:
This release is focused on battery faults detection.


Battery Block Delta Chart

The Battery Block Delta chart shows maximum, average and minimum value of the battery blocks.
Note that blocks at maximum (or minimum) values at any given instant may not be always the same blocks.
Delta is shown on the right side scale: this is the difference between maximum and minimum values.
Worn out batteries have larger deltas.


Battery Temperature Chart

The Battery Temperature Chart shows HV temperature over time.
Battery is split in 3 sections, each one having a termal sensor.
Tipically, the second section has the highest temperature, being surrounded by the other 2.
The chart also highlights 3 notable thresholds:
  • 35C: the HV fan starts spinning
  • 42C: EV mode is not available any more due to high temperature
  • 50C: the HV fan spins at maximum rate


Tuesday, April 28, 2015

How does a failed battery look like?

Here are 2 Prius of the same age, with comparable mileage:

  • Prius 3, 2009, 140.000 km, good battery
The first one has a perfectly fit battery.
The Battery Block Delta chart shows how all blocks values are close to each others:
Max Delta is 0.39
Average Delta is 0.10


  • Prius 3, 2009, 183.000 km, failed battery
The Battery Block Delta charts shows that max and min values are much more divergent.
Max Delta is 2.79
Average Delta is 0.34, three times as much as the other battery.


By comparison, let's look at a brand new Auris, that uses the same battery model as the Prius 3:
  • Auris, 2015, 1.000 km, good battery
Max Delta is 1.0, but we can see from the chart that this is due to isolated spikes, probably associated to engine ignitions or others sudden current surge events
Average Delta is 0.10, just as the other good battery.


Here's an older car:
  • Prius 2, 2005, 270.000 km, good battery
Max Delta is 1.08
Average Delta is 0.15, a little worse than the brand new battery


Sunday, April 26, 2015

Investigating a P0A80 Hybrid Battery Fault Code

On the Hybrid Synergy Forum, a user posted a thread about an Hybrid System error he had on his 189.000 km Prius 3.

We arranged to capture a Torque log to see if we could find the faulty element of the battery.
We drove to stress the battery a bit, by driving using EV traction alone, forcing charges by ICE and by brakings.
The car behaved erraticaly: the EV mode was refused even with a full battery and ICE won't stop, even standing still in P and with no HV charge in progress.
We suspected a temperature issue in the HV, so while parked we checked them up:

  • TB1: 38.9C
  • TB2: 43.55C
  • TB3: 47.78C

There was an unusually large difference between the 3 values, and while the fan was running apparently fine, TB3 was holding steady. Even with the car parked and no significant currents from the battery, temperature didn't decrease.
We powered off the car with a final SOC value of 54.1
When we powered it on again after a minute, SOC jumped instantly to 72.9.
We drove in EV trying to deplete the battery and then, suddenly, SOC went down from 62 to 24 in 15 seconds, causing ICE to start charging the battery.
That condition seems to have triggered the error, that showed up on the multifunction display:


The Current Flow chart shows the sudden SOC drop:


The Battery Block chart gives an immediate evidence that something is working out of specs: 


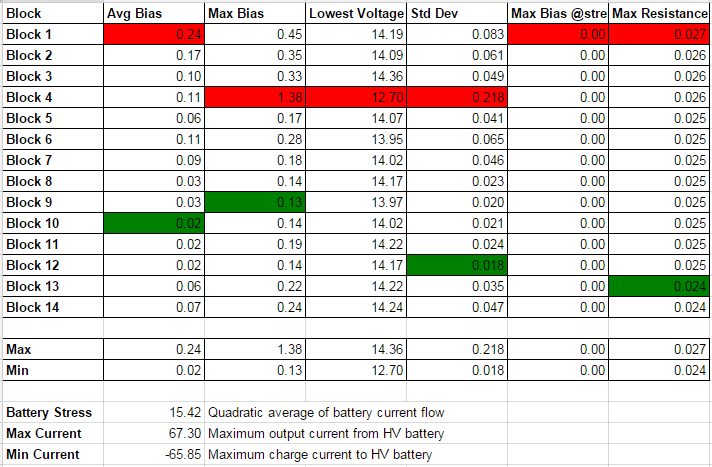
The HV Fitness sheet shows how Block 4 has the worst lowest voltage of all, the highest bias and standard deviation from battery average value.


Clearly, Block 4 needs replacing.


Saturday, April 18, 2015

1000

Checking the add-on store today, I just saw that we reached 1000 users.
Thank you all.

Sunday, March 29, 2015

Fuel Flow at Highway Speeds

Here's a chart with fuel flow by speed.
It comes from a 4 hours highway trip.
Trip was back and forth, to compensate for road altitude and SOC differences, as SOC average value was 60.49%.
The chart starts at 80 km/h where EV is not available, so this is indeed only ICE consumption.
Interesting curves here are the bold blue one, representing average RPM at each given speed, and the yellow one, average fuel flow at the same speed.
We can note that until a little more than 90 km/h, the fuel curve follows RPM curve by staying under it. After that, fuel flow begin to grow with a steeper angle.
I suspect aerodynamic drag may be the primary suspect here.


Chart with added load and enhanced grid:

Chart from a user willing to drive way faster than me:


Relationship between Fuel and Speed


Sunday, March 22, 2015

RPM Distribution

This chart shows minimum, maximum and average RPM for each speed value in a trip.
This actually makes sense in cars without a CVT-style gearbox, as the manual pictured below.
Average fuel consumption is also pictured aside RPM values.


R27

News:
  • SOC drifting detection has been moved to additional analytics
  • RPM Distribution sheet added