I saw that a Portuguese Prius forum has noticed Torque Log Analyzer:
http://prius-pt.com/cafe/forums/p/4496/46025.aspx
Thursday, November 28, 2013
Tuesday, November 26, 2013
Monday, November 25, 2013
Introduction to Hybrid
Driving an hybrid car seems to scare some people.
Here is a "for dummies"-style introduction which I gave a little contribution in writing:
http://www.hybrid-synergy.eu/showthread.php?tid=43957&pid=384265#pid384265
Here is a "for dummies"-style introduction which I gave a little contribution in writing:
http://www.hybrid-synergy.eu/showthread.php?tid=43957&pid=384265#pid384265
Service invoked too many times
Service invoked too many times in a short time: spreadsheets. Try Utilities.sleep(1000) between calls.
If you are getting this error while running AnalyzeTorqueLogs or Resume, try running them from within the editor, by selecting "Tool / Script editor..." and then "Run" from there.

If you are getting this error while running AnalyzeTorqueLogs or Resume, try running them from within the editor, by selecting "Tool / Script editor..." and then "Run" from there.
V25 available
News:
- corrected one error that prevented execution if the sweet spot PIDs were unavailable
Friday, November 22, 2013
V24 released
- S1 Chart

- Added Coolant Temperature to SOC Chart
- Added Coolant Temperature and Altitude to Mileage Chart
- Charts now reports Altitude delta rather than absolute, to avoid scaling issue in mountain trips
Thursday, November 21, 2013
Changing scale from time to distance
Most charts have time on the X axis.
Here's how to change to distance.
Note: you must have "Trip Distance" PID in the log for this to work.
Example: changing from time to distance in the Speed / Altitude chart.
Go to the Speed / Altitude chart

Click anywhere into the chart to cause the edit arrow to appear:
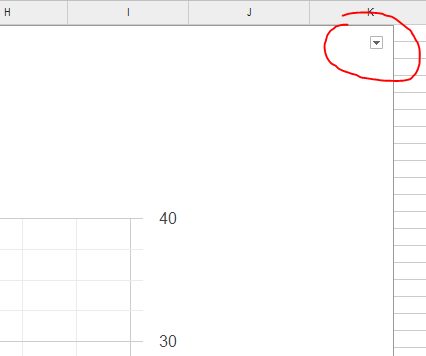
Click on the arrow and then select "Advanced edit..."

In the chart editor window select "Start"

Then click on the "Get data range" grid

Select the first data row

Click on the "Data" sheet

Click on the column header of the "Trip Distance" PID: the whole column will change color and the data box will change with the column letter.

Click Ok and then Update on the chart editor window.
Chart will be updated with km on the X axis.

Here's how to change to distance.
Note: you must have "Trip Distance" PID in the log for this to work.
Example: changing from time to distance in the Speed / Altitude chart.
Go to the Speed / Altitude chart
Click anywhere into the chart to cause the edit arrow to appear:
Click on the arrow and then select "Advanced edit..."
In the chart editor window select "Start"
Then click on the "Get data range" grid
Select the first data row
Click on the "Data" sheet
Click on the column header of the "Trip Distance" PID: the whole column will change color and the data box will change with the column letter.
Click Ok and then Update on the chart editor window.
Chart will be updated with km on the X axis.
Extending charts
Builtin charts can be extended easily.
Example: adding Coolant Temperature to Speed / Altitude chart.
Go to the Speed / Altitude chart
Click anywhere into the chart to cause the edit arrow to appear:
Click on the arrow and then select "Advanced edit..."
In the chart editor window select "Start"
Then click on the "Get data range" grid
Select "Add another range"

Another box will appear

Click on the "Data" sheet

Click on the column header you want to add: the whole column will change color and the data box will fill up with the column letter.

Click Ok and then Update on the chart editor window.
Chart will be updated with the selected column

Example: adding Coolant Temperature to Speed / Altitude chart.
Go to the Speed / Altitude chart
Click anywhere into the chart to cause the edit arrow to appear:
Click on the arrow and then select "Advanced edit..."
In the chart editor window select "Start"
Then click on the "Get data range" grid
Select "Add another range"
Another box will appear
Click on the "Data" sheet
Click on the column header you want to add: the whole column will change color and the data box will fill up with the column letter.
Click Ok and then Update on the chart editor window.
Chart will be updated with the selected column
Wednesday, November 20, 2013
V23 released
News:

- better handling of resume on "Execution time exceeded" error
- sweet stop analysis (low RPMs with high mileage)
- two new PIDs required for sweet spot: "Timing Advance", "Engine Coolant temperature".

Tuesday, November 19, 2013

Thursday, November 14, 2013
ECO
While investigating on ECO mode, I was curious to check if that mode affects fuel consumption.
I've driven the same track in Normal and in ECO mode:

 I've found no differences.
Let's see Accelerator Pedal:

 Wider range in ECO.
I've driven the same track in Normal and in ECO mode:
Let's see Accelerator Pedal:
Wednesday, November 13, 2013

V21 released
News:

- Glide evaluation now considers accelerator pressed
- Pulse evaluation rewritten
- Corrected error in trip lenght
- Mileage chart has now a cap at 50 km/l to avoid overscaling (cap is customizable, see Tools/Script editor)
Monday, November 11, 2013
V20 released
News:
- better diagnostics in log error messages
- pulse detection now check if accelerator is pressed
- longest pulse is now reported in analysis
- glide is considered valid only if speed > 10 (to avoid crawling)
- glide chart is drawn even if pulse is not available
Sunday, November 10, 2013
V19 released
News:
- Hybrid chart now more readable
- Added Pulse evaluation, with new chart and map
- Corrected error on Glide % in Analysis sheet
Hybrid Art
Pick up a trip log.
Classify car states.
Assign a value to each state so that longer state have a lower value.
Draw a graph:

A little Manhattan skyline, a little Tron, a little Mondrian...
Classify car states.
Assign a value to each state so that longer state have a lower value.
Draw a graph:
A little Manhattan skyline, a little Tron, a little Mondrian...
Saturday, November 9, 2013
V18 released
News:
- Automatic removal of duplicate header lines (but check log sheet and investigate why they're present)
- RPM / Fuel Flow chart now uses corrected fuel flow
- Count of EV Excess usage added to Analysis sheet
- Fuel Comparison chart is drawn only with original fuel usage if fuel can't be corrected by missing PID (check log sheet)
- Uncorrected fuel economy added to Analysis sheet
Friday, November 8, 2013
V17 released
News:


- Torque fuel flow PID seems to be affected by some errors on hybrid cars: it accounts for some fuel usage even when the engine is off: this release include some heuristics to correct fuel usage.
- Added a comparison chart between original fuel usage from Torque and the corrected one
- Rewritten coasting and ICE off detection for better precision. Note that this now requires "Actual Engine Torque" PID.
- Added chart of car states (EV, ICE Off, ICE spinning, Braking, Coasting)
- Km/l is now capped at 99 to avoid scale issues on chart.
Wednesday, November 6, 2013
Torque Fuel Used
It seems that the "Fuel Used" PID is affected by some errors: sometimes it reports a little consumption even with RPM = 0.
I'm currently experimenting with some heuristics of fuel correction for the next version.
Here is a comparison chart between original Fuel Used and the corrected one:

I'm currently experimenting with some heuristics of fuel correction for the next version.
Here is a comparison chart between original Fuel Used and the corrected one:
Auris RPM at highway speed

Note that after 3500 RPM the steepness change.
Sunday, November 3, 2013
S1 comparison
Here is the S1 phase from Yaris and Auris.
First a couple of Yaris:


All shows the same behavior: SOC gains more than 5% (7,05, 5,88, 12,1 respectively), with max currents between 34 and 29A.
The Auris shows a different pattern:


SOC gain is very little (2.7%, 5.09%, 1.5%).
Note the longer S1 of the second car. It doesn't seem to stop even at 40 degrees.
Higher current generation begins in the later phase and even then, absolute current values are lower that those from the Yaris.
The last chart lacks Current and Temperature, but it shows very little SOC gain as the others.
First a couple of Yaris:
All shows the same behavior: SOC gains more than 5% (7,05, 5,88, 12,1 respectively), with max currents between 34 and 29A.
The Auris shows a different pattern:
SOC gain is very little (2.7%, 5.09%, 1.5%).
Note the longer S1 of the second car. It doesn't seem to stop even at 40 degrees.
Higher current generation begins in the later phase and even then, absolute current values are lower that those from the Yaris.
The last chart lacks Current and Temperature, but it shows very little SOC gain as the others.
Saturday, November 2, 2013
V16 released
News:

- SOC Chart
- PID names are now more flexible (it should avoid some errors when importing csv files)
Friday, November 1, 2013
V15 released
News:
- Distance and KPL added to analysis sheet
- Check for AP min value (should catch some import/capture errors)
- Added Hybrid chart for those who don't want to use GPS
- Increased chart size
- Coasting and and ICE Off now consider fuel flow and are not fooled by Cruise Control (Fuel Flow PID is mandatory)
- Better EV mode detection

Subscribe to:
Posts (Atom)